Introduction
We needed a Apache web server monitoring that is able to watch the current web server session status. It should alert us for reaching the web servers client session limit with the potentially dropped user sessions that follow.
We are already using Nagios 'check_http' plugin to monitor site access. This plugin also provides the size and access time for the retrieved URL as a perfomance indicator. This data can help identify access performance bottlenecks, but is influenced by the network speed and therefore an very unreliable indicator, as our graphs show.
We also have historical monitoring that can provide session information (i.e. through webalizer). But this is only great to monitor the overall trend, it cannot alarm for ad-hoc session peaks since the information gathered is based on historical log data.
Plugin Design
The following method describes the setup for Apache session load monitoring using the Apache module 'mod_status'. It has been tested unter Nagios 3.0.6 running on a SuSE Linux Enterprise Server 10 SP2, monitoring Apache2 webservers running on various platforms such as Linux, Windows and AIX.
Providing Apache session information with 'mod_status'
Introduced with Apache 1.1, the module mod_status can provide a simple, static HTML page with session details under the servers location /server-status. More information is available at the Apache project for versions 1.3, 2.0 and 2.2.
First, we need to load the module. Apache modules are enabled using the Apache directive "LoadModule
# vi /etc/sysconfig/apache2

APACHE_MODULES="authz_host actions alias auth_basic authz_groupfile authn_file
authz_user autoindex cgi dir include log_config mime negotiation setenvif ssl
php5 perl python apparmor auth_pam auth_sys_group authz_default rewrite status

# grep status /etc/apache2/sysconfig.d/loadmodule.conf
LoadModule status_module               /usr/lib64/apache2-prefork/mod_status.so
Now we need to enable extended status information and restrict access to the web location. Again, depending on the web server configuration, the place to configure could be in the global httpd.conf file, or in one of its includes. For SLES10, it is in the mod_status.conf file.
# cat mod_status.conf
#
# Allow server status reports generated by mod_status,
# with the URL of http://servername/server-status
#
# see http://httpd.apache.org/docs-2.2/mod/mod_status.html
#
<IfModule mod_status.c>
    <Location /server-status>
        SetHandler server-status
        Order deny,allow
        Deny from all
        Allow from 192.168.103.32 192.168.103.34 127.0.0.1 localhost
    </Location>
    ExtendedStatus On
</IfModule>
After we updated the Apache configuration, we reload it to enable the new module. Now, the server-status webpage should be be available for access from the allowed client IP's. A example server-status page is saved here.
The plugin 'check_apachestatus.pl'
Nagiosexchange provided the script check_apachestatus.pl as a Nagios plugin to process the output of mod_status. It uses the Perl LWP library to make a http "GET" for the location /server-status and parses the output accordingly. I updated the script to to make it work independendly of the nagios perl module and to work with both mod_status settings for "ExtendedStatus On" or not. It can be found here. If "ExtendedStatus" is enabled, then extra performance data is returned. Let's place the plugin in 'nagioshome'/libexec and a test by hand will verify the correct function:
 susie112:/srv/app/nagios/libexec # ./check_apachestatus.pl -H 192.168.103.34
OK 0.038002 seconds response time. Idle 8, busy 1, open slots 141 | 'Waiting for
Connection'=8 'Starting Up'=0 'Reading Request'=0 'Sending Reply'=1 'Keepalive
(read)'=0 'DNS Lookup'=0 'Closing Connection'=0 'Logging'=0 'Gracefully finishin
g'=0 'Idle cleanup'=0 'Open slot'=141 'Requests/sec'=0.1 'B per sec'=516.0B 'kB
per Request'=7.0kB
Allright, we receive data for Nagios, but our server load is empty! Let's generate some artificial web load. I am going to use the load generator 'curl-loader' to max out the sessions my web server has available (MaxClients 150). I already have one monitoring connection, so with 150 additional parallel clients we should start seeing a few timeout errors for clients that cannot connect anymore. We also going to verify the plugins correct alarming by setting the warning threshold to 10 sessions and critical to 2 session left (-w 10 -c 2).
# vi frank4dd-conf
########### GENERAL SECTION ################################
BATCH_NAME=frank4dd-test
CLIENTS_NUM_MAX=150
CLIENTS_NUM_START=150
CLIENTS_RAMPUP_INC=1
INTERFACE   =eth0
NETMASK=255.255.255.0
IP_ADDR_MIN= 192.168.203.99
IP_ADDR_MAX= 192.168.203.99
CYCLES_NUM= -1
URLS_NUM= 1
########### URL SECTION ####################################
URL=http://192.168.103.34/wpad.dat
URL_SHORT_NAME="frank4dd-80-wpad"
REQUEST_TYPE=GET
TIMER_URL_COMPLETION = 3000
TIMER_AFTER_URL_SLEEP =100

~ # ./curl-loader -f frank4dd-conf

============  loading batch is: frank4dd- ======================================

 Operations:             Success                 Failed                Timed out
URL0:frank4dd-80-       3158   6040             7      7               7      7
--------------------------------------------------------------------------------
Interval stats (latest:3 sec, clients:150, CAPS-curr:1046):
H/F   Req:3118,1xx:0,2xx:3125,3xx:0,4xx:0,5xx:0,Err:0,T-Err:7,D:1ms,D-2xx:1ms,\
Ti:2167740B/s,To:129166B/s
H/F/S Req:0,1xx:0,2xx:0,3xx:0,4xx:0,5xx:0,Err:0,T-Err:0,D:0ms,D-2xx:0ms,Ti:0B/\
s,To:0B/s
--------------------------------------------------------------------------------
Summary stats (runs:6 secs, CAPS-average:1032):
H/F   Req:6040,1xx:0,2xx:6040,3xx:0,4xx:0,5xx:0,Err:0,T-Err:7,D:1ms,D-2xx:1ms,\
Ti:2094889B/s,To:124971B/s
H/F/S Req:0,1xx:0,2xx:0,3xx:0,4xx:0,5xx:0,Err:0,T-Err:0,D:0ms,D-2xx:0ms,Ti:0B/\
s,To:0B/s
===============================================================================
 Manual: clients:max[150],curr[150]. Inc num: [+|*].
===============================================================================

# /srv/app/nagios/check_apachestatus.pl -H 192.168.103.34 -w 10 -c 2
CRITICAL 0.347821 seconds response time. Idle 0, busy 148, open slots 2 | 'Wai\
ting for Connection'=0 'Starting Up'=0 'Reading Request'=0 'Sending Reply'=3
'Keepalive (read)'=141 'DNS Lookup'=0 'Closing Connection'=0 'Logging'=4
'Gracefully finishing'=0 'Idle cleanup'=0 'Open slot'=2 'Requests/sec'=0.4
'B per sec'=676.0B 'B per Request'=1850.0B
Configuring the new Nagios Service
Here is a saved /server-status page showing how mod_status displays our full sessions table. Next, we add the new Nagios plugin command definition for our new check. I named it check_http_stat in 'nagioshome'/commands.cfg and now we can configure our first apache load service object. Add the new configuration file to 'nagioshome'/etc/nagios.cfg, restart Nagios and check for the new service marked 'pending'.
~ # vi /srv/app/nagios/etc/objects/commands.cfg

# check_apachestatus.pl -H  [-p ] [-t ] [-w  -c ] [-V]
define command{
  command_name    check_http_stat
  command_line    $USER1$/check_apachestatus.pl -H $HOSTADDRESS$ $ARG1$
}

# vi website-services.cfg
###############################################################################
# Define a servicegroup for web service checks
# web service checks will be a member of this group
###############################################################################
define servicegroup{
  servicegroup_name        website-checks ; The name of the hostgroup
  alias                    Web Site Checks ; Long name of the group
}
define servicegroup{
  servicegroup_name        website-load ; The name of the hostgroup
  alias                    Web Site Load ; Long name of the group
  members                  frank4dd-server,apache-load-frank4dd,
}
###############################################################################
# Define the environment check template service
###############################################################################
define service{
  name                          generic-website
  active_checks_enabled         1
  passive_checks_enabled        1
  parallelize_check             1
  obsess_over_service           1
  check_freshness               0
  notifications_enabled         1
  event_handler_enabled         1
  flap_detection_enabled        1
  failure_prediction_enabled    1
  process_perf_data             1
  retain_status_information     1
  retain_nonstatus_information  1
  is_volatile                   0
  check_period                  24x7
  max_check_attempts            4
  normal_check_interval         5
  retry_check_interval          1
  contact_groups                frankonly
  notification_options          c,r
  notification_interval         180
  notification_period           24x7
  register                      0
  servicegroups                 website-checks
}
###############################################################################
# Check web access to frank4dd-server
###############################################################################
define service{
  use                           generic-website
  host_name                     frank4dd-server
  service_description           website-check-frank4dd
  check_command                 check_http!-S -a nagios:nagios2check
}
define serviceextinfo {
  service_description           website-check-frank4dd
  host_name                     frank4dd
        use                     basic
}
###############################################################################
# Check web load on frank4dd-server
###############################################################################
define service{
  use                           generic-website
  host_name                     frank4dd-server
  service_description           apache-load-frank4dd
  check_command                 check_http_stat!-w 30 -c 15
}
define serviceextinfo {
  service_description           apache-load-frank4dd
  host_name                     frank4dd-server
        use                     basic
}
Comments on using 'check_apachestatus.pl'
I slightly modified the original script 'check_apachestatus.pl' and removed the dependency on the Nagios perl modules (utils.pm). Now the script runs independend of the Nagios server itself. Some of my Nagios services need to call 'check_apachestatus.pl' through the snmp extend access method, using the 'check_snmp_extend.sh' plugin. Some of my hosts are in a DMZ with only port 443 (HTTPS) open, so I cannot access port 80 for /server-status directly over the network. With SNMP access open for the Nagios monitoring system, I placed the session load monitoring 'check_apachestatus.pl' on the host itself were it is called by the SNMP daemon (configured in /etc/snmp/snmpd.conf).
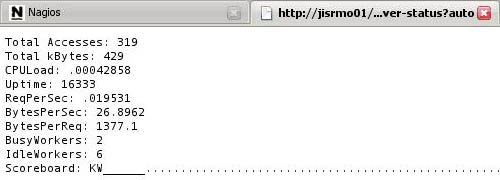
Also, 'check_apachestatus.pl' currently parses /server-status, while mod_status provides text output in a standard format by using the URL /server-status&auto, which is possibly a better way to retrieve the data (example). Your opinion is very welcome.
In the latest version 1.6, the plugin check_apache.pl supports connections through a web proxy and, if /server-status is provided through SSL, HTTP/S connections. For the combination of both, using a proxy with HTTP/s, it was quite tricky to make it work, using Crypt::SSLeay with the HTTPS_PROXY environment variable. Finally, a trick for the special case when your system is defined in Nagios using a different (i.e. NAT) IP address while the URL for /server-status needs another (real) IP:
check_command check_http_stat!-x "http://192.168.100.184:80" -s -H 211.145.179.138
Credits, copyrights and original scripts
- The Apache project with documentation for Apache mod_status URL
- The Nagios plugin check_apachestatus.pl, the latest version 1.6 with proxy and SSL support here
- The Nagios plugin check_apachestatus_v15.pl, the obsolete version 1.5 with 'ExtendedStatus Off' support here
- The Nagios plugin check_apachestatus_v14.pl, the old version 1.4 with removed dependencies on Nagios utils.pm here
- The old Nagios plugin check_apachestatus.pl version 1.3, original from NagiosExchange
- Nagios and the Nagios community at http://www.nagios.org/
- The web load generator curl-loader by Robert Iakobashvili and Michael Moser at http://curl-loader.sourceforge.net/
- SUSE Linux and SLES10 are products and trademarks of Novell, Inc. http://www.suse.com/
- Further Nagios documentation is available here http://nagios.fm4dd.com/docs/en/